Funciones para trabajar con "OCTAVE": Pds::Octave::Plot::CurveXY(),Pds::Octave::Plot::PointsX2DYW(), etc.
Más...
|
Salva datos de matrices
|
| bool | Pds::Octave::Plot::LogLogXY (const Pds::Vector &X, const Pds::Vector &Y, const std::string &octfilename, const std::string &imgfilename) |
| | Plot de X vs. Y. Más...
|
| |
| bool | Pds::Octave::Plot::LogLogXYXY (const Pds::Vector &X, const Pds::Vector &Y, const Pds::Vector &X2, const Pds::Vector &Y2, const std::string &octfilename, const std::string &imgfilename) |
| | Plot de X vs. Y. Más...
|
| |
| bool | Pds::Octave::Plot::Bar (const Pds::Vector &X, const Pds::Vector &Y, const std::string &octfilename, const std::string &imgfilename) |
| | Plot bar X vs. Y. Más...
|
| |
| bool | Pds::Octave::Plot::CurveXY (const Pds::Vector &X, const Pds::Vector &Y, const std::string &octfilename, const std::string &imgfilename, bool EnableLine=false) |
| | Plot de X vs. Y. Más...
|
| |
| bool | Pds::Octave::Plot::CurveXY (const std::vector< Pds::Vector > &X, const std::vector< Pds::Vector > &Y, const std::string &octfilename, const std::string &imgfilename, bool EnableLine=false) |
| | Plot de X vs. Y. Más...
|
| |
| bool | Pds::Octave::Plot::CurveXYXY (const Pds::Vector &X, const Pds::Vector &Y, const Pds::Vector &Xs, const Pds::Vector &Ys, const std::string &octfilename, const std::string &imgfilename, bool EnableLine=false) |
| | Plot de X vs. Y junto con Xs vs. Ys. Más...
|
| |
| bool | Pds::Octave::Plot::CurveX2DYX2DY (const Pds::Matrix &X, const Pds::Vector &Y, const Pds::Matrix &Xs, const Pds::Vector &Ys, const std::string &octfilename, const std::string &imgfilename) |
| | Plot de X vs. Y junto con Xs vs. Ys. Donde X y Xs tienen 2 dimensiones. Más...
|
| |
|
Salva datos de matrices
|
| bool | Pds::Octave::Plot::PointsX2D (const Pds::Matrix &X, const std::string &octfilename, const std::string &imgfilename) |
| | Plot de muestras en 2D en las columnas X. Más...
|
| |
| bool | Pds::Octave::Plot::PointsX2D (const Pds::Matrix &X0, const Pds::Matrix &X1, const std::string &octfilename, const std::string &imgfilename) |
| | Plot de muestras en 2D en las columnas de X0(blue) y X1(red). Más...
|
| |
| bool | Pds::Octave::Plot::PointsX2DY (const Pds::Matrix &X, const Pds::Vector &Y, const std::string &octfilename, const std::string &imgfilename) |
| | Plot de muestras en 2D en las columnas X, clasificadas de forma binaria con Y>=0.5, 0 para azul 1 para rojo. Más...
|
| |
| bool | Pds::Octave::Plot::PointsX2DYW (const Pds::Matrix &X, const Pds::Vector &Y, const Pds::Vector &W, const std::string &octfilename, const std::string &imgfilename) |
| | Plot de muestras en 2D en las columnas X, clasificadas de forma binaria con Y>=0.5, 0 para azul 1 para rojo. Más...
|
| |
|
Salva datos de matrices
|
| bool | Pds::Octave::Plot::ScatterX2DY (const Pds::Matrix &X, const Pds::Vector &Y, const std::string &octfilename, const std::string &imgfilename) |
| | Plot de muestras en 2D en las columnas X, muestra los valores de Y con una degradación de colores. Más...
|
| |
| bool | Pds::Octave::Plot::ScatterX2DYP (const Pds::Matrix &X, const Pds::Vector &Y, const Pds::Vector &P, const std::string &octfilename, const std::string &imgfilename) |
| | Plot de muestras en 2D en las columnas X, muestra los valores de Y con una degradación de colores. Más...
|
| |
| bool | Pds::Octave::Plot::ScatterX2DYW (const Pds::Matrix &X, const Pds::Vector &Y, const Pds::Vector &W, const std::string &octfilename, const std::string &imgfilename) |
| | Plot de muestras en 2D en las columnas X, muestra los valores de Y con una degradación de colores. Más...
|
| |
| bool | Pds::Octave::Plot::ScatterX3DY (const Pds::Matrix &X, const Pds::Vector &Y, const std::string &octfilename, const std::string &imgfilename) |
| | Plot de muestras en 3D en las columnas X, muestra los valores de Y con una degradación de colores. Más...
|
| |
|
| bool | Pds::Octave::Plot::Surf (const Pds::Matrix &X, const Pds::Matrix &Y, const Pds::Matrix &Z, const std::string &octfilename, const std::string &imgfilename) |
| | Plot la matriz usando surf. Más...
|
| |
| bool | Pds::Octave::Plot::Surf (const Pds::Matrix &Z, const std::string &octfilename, const std::string &imgfilename) |
| | Plot la matriz usando surf. Más...
|
| |
| bool | Pds::Octave::Plot::SurfC (const Pds::Matrix &X, const Pds::Matrix &Y, const Pds::Matrix &Z, const std::string &octfilename, const std::string &imgfilename) |
| | Plot la matriz usando surfc. Más...
|
| |
| bool | Pds::Octave::Plot::SurfCWithPoint (const Pds::Matrix &X, const Pds::Matrix &Y, const Pds::Matrix &Z, const Pds::Vector &P3, const std::string &octfilename, const std::string &imgfilename) |
| | Plot la matriz usando surfc y un punto usando scatter3. Más...
|
| |
Funciones para trabajar con "OCTAVE": Pds::Octave::Plot::CurveXY(),Pds::Octave::Plot::PointsX2DYW(), etc.
#include <Pds/FuncOctavePlot>
◆ ExecuteFile()
| int Pds::Octave::ExecuteFile |
( |
const std::string & |
octfilename | ) |
|
Ejecuta un archivo de texto. Exemplo:
- Parámetros
-
| [in] | octfilename | Nombre de archivo del archivo octave a ejecutar. |
◆ LogLogXY()
| bool Pds::Octave::Plot::LogLogXY |
( |
const Pds::Vector & |
X, |
|
|
const Pds::Vector & |
Y, |
|
|
const std::string & |
octfilename, |
|
|
const std::string & |
imgfilename |
|
) |
| |
Plot de X vs. Y.
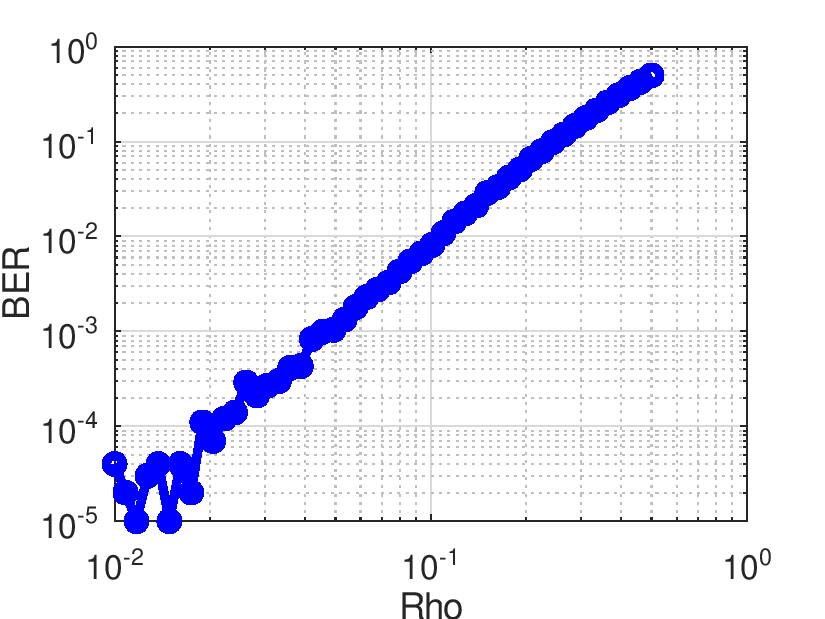
LogLogXY
- Parámetros
-
| [in] | X | Vector de posición x. |
| [in] | Y | Vector de posición y. |
| [in] | octfilename | Nombre de archivo del archivo octave a generar. |
| [in] | imgfilename | Nombre de archivo del archivo de imagen a generar. |
- Devuelve
- Retorna true si todo sale bien o false si no.
◆ LogLogXYXY()
Plot de X vs. Y.
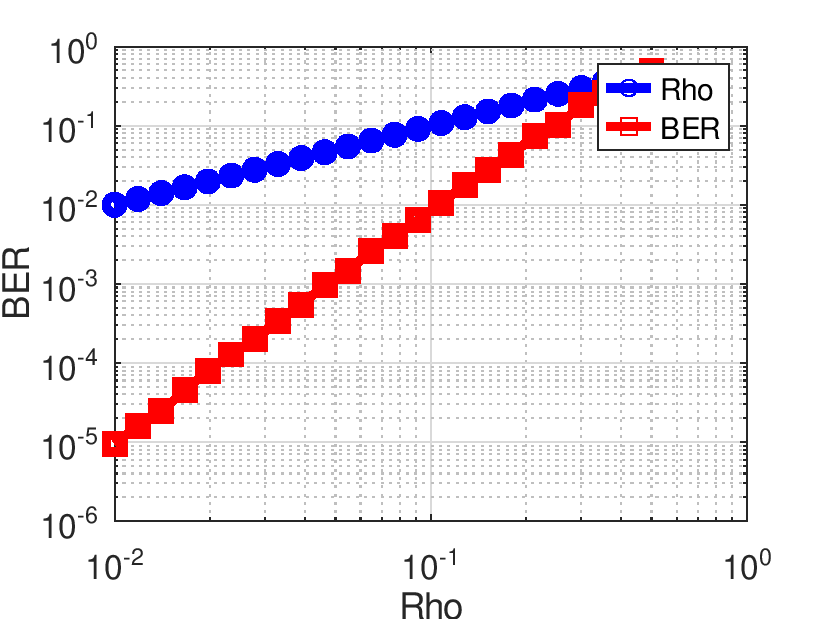
LogLogXY
- Parámetros
-
| [in] | X | Vector de posición x. |
| [in] | Y | Vector de posición y. |
| [in] | X2 | Vector de posición x. |
| [in] | Y2 | Vector de posición y. |
| [in] | octfilename | Nombre de archivo del archivo octave a generar. |
| [in] | imgfilename | Nombre de archivo del archivo de imagen a generar. |
- Devuelve
- Retorna true si todo sale bien o false si no.
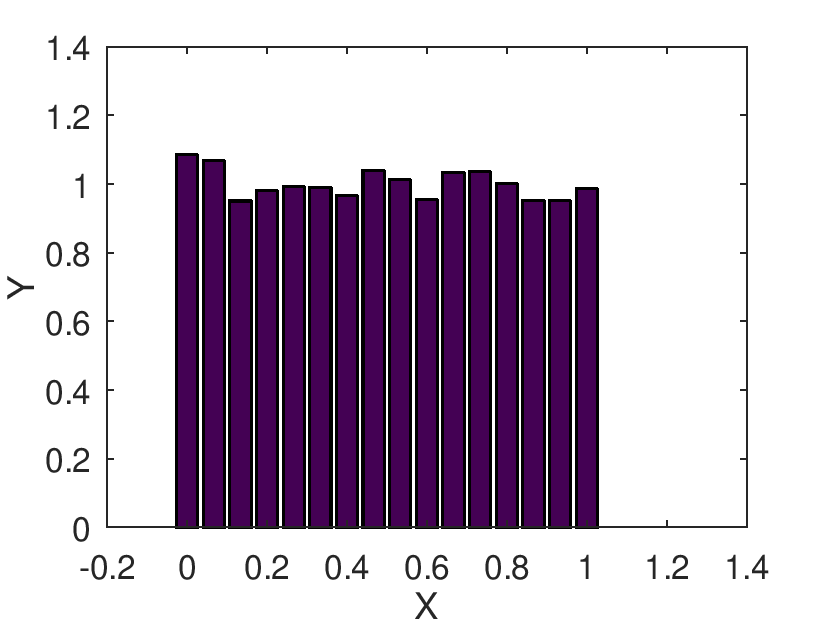
◆ Bar()
| bool Pds::Octave::Plot::Bar |
( |
const Pds::Vector & |
X, |
|
|
const Pds::Vector & |
Y, |
|
|
const std::string & |
octfilename, |
|
|
const std::string & |
imgfilename |
|
) |
| |
◆ CurveXY() [1/2]
| bool Pds::Octave::Plot::CurveXY |
( |
const Pds::Vector & |
X, |
|
|
const Pds::Vector & |
Y, |
|
|
const std::string & |
octfilename, |
|
|
const std::string & |
imgfilename, |
|
|
bool |
EnableLine = false |
|
) |
| |
Plot de X vs. Y.
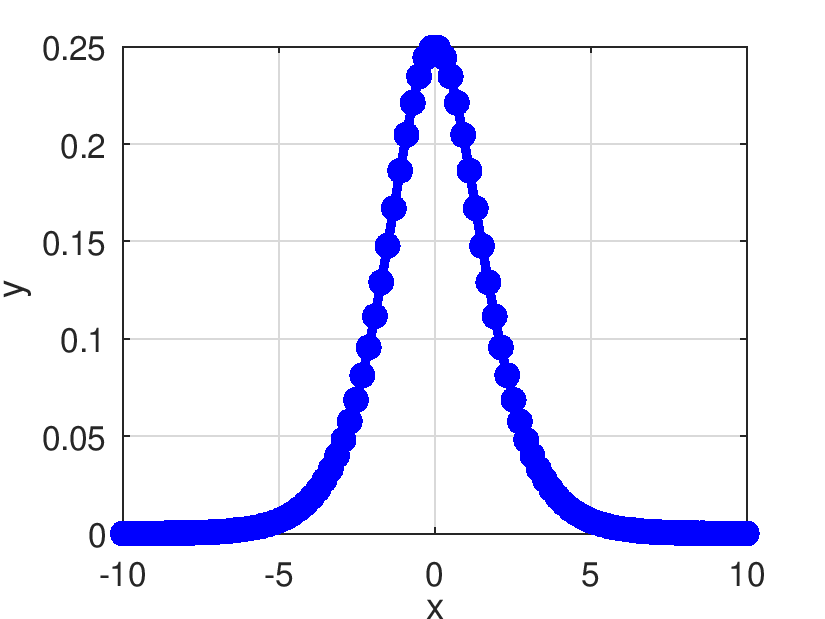
PlotXY
- Parámetros
-
| [in] | X | Vector de posición x. |
| [in] | Y | Vector de posición y. |
| [in] | octfilename | Nombre de archivo del archivo octave a generar. |
| [in] | imgfilename | Nombre de archivo del archivo de imagen a generar. |
| [in] | EnableLine | Habilita un dibujo con lineas, cuando es falso usa puntos. |
- Devuelve
- Retorna true si todo sale bien o false si no.
- Ejemplos
- example_mathmatrix_plog2p.cpp.
◆ CurveXY() [2/2]
| bool Pds::Octave::Plot::CurveXY |
( |
const std::vector< Pds::Vector > & |
X, |
|
|
const std::vector< Pds::Vector > & |
Y, |
|
|
const std::string & |
octfilename, |
|
|
const std::string & |
imgfilename, |
|
|
bool |
EnableLine = false |
|
) |
| |
Plot de X vs. Y.
PlotXY
- Parámetros
-
| [in] | X | Vector de vectores de posición x. |
| [in] | Y | Vector de vectores de posición y. |
| [in] | octfilename | Nombre de archivo del archivo octave a generar. |
| [in] | imgfilename | Nombre de archivo del archivo de imagen a generar. |
| [in] | EnableLine | Habilita un dibujo con lineas, cuando es falso usa puntos. |
- Devuelve
- Retorna true si todo sale bien o false si no.
◆ CurveXYXY()
| bool Pds::Octave::Plot::CurveXYXY |
( |
const Pds::Vector & |
X, |
|
|
const Pds::Vector & |
Y, |
|
|
const Pds::Vector & |
Xs, |
|
|
const Pds::Vector & |
Ys, |
|
|
const std::string & |
octfilename, |
|
|
const std::string & |
imgfilename, |
|
|
bool |
EnableLine = false |
|
) |
| |
◆ CurveX2DYX2DY()
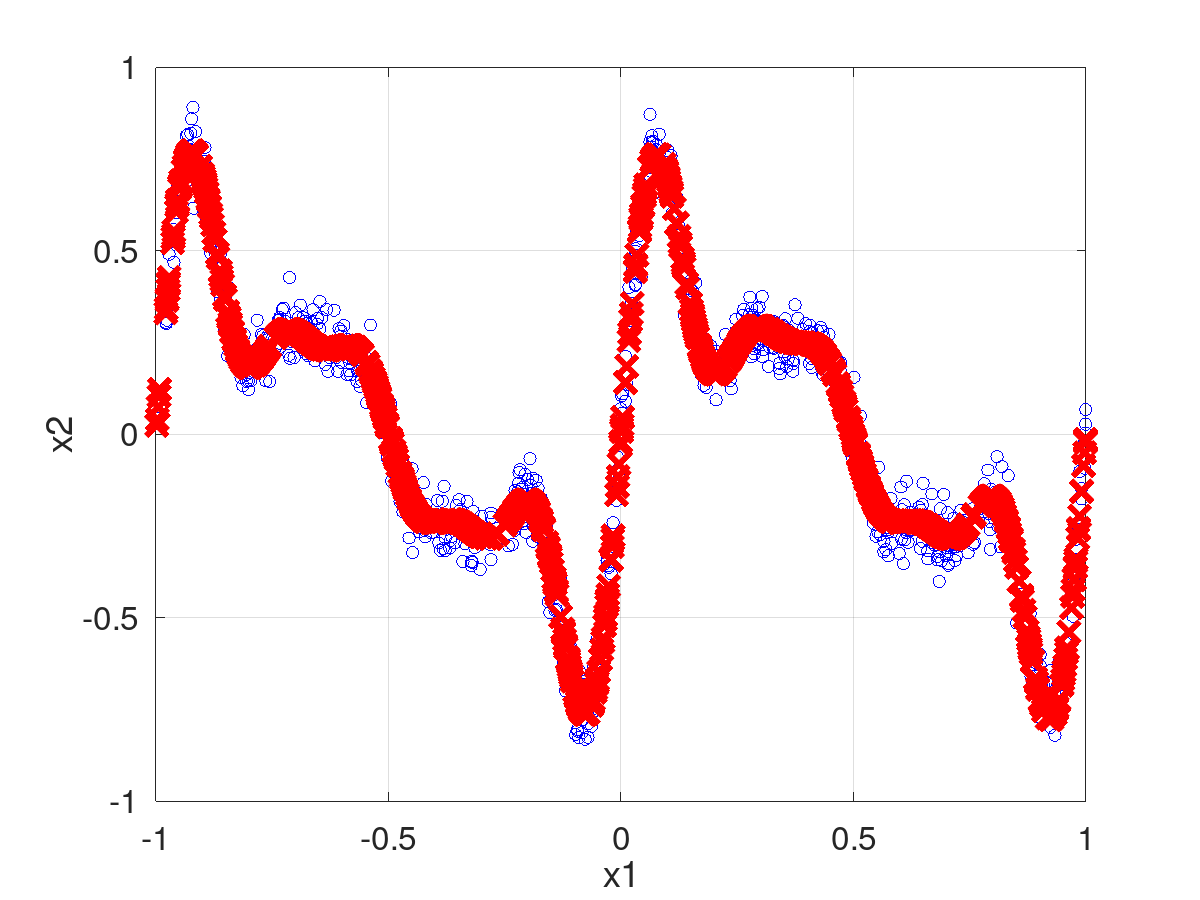
Plot de X vs. Y junto con Xs vs. Ys. Donde X y Xs tienen 2 dimensiones.
CurveX2DYX2DY
- Parámetros
-
| [in] | X | Matriz de posición x. Graficado con puntos azules. |
| [in] | Y | Vector de posición y. Graficado con puntos azules. |
| [in] | Xs | Matriz de posición x. Graficado con puntos rojos. |
| [in] | Ys | Vector de posición y. Graficado con puntos rojos. |
| [in] | octfilename | Nombre de archivo del archivo octave a generar. |
| [in] | imgfilename | Nombre de archivo del archivo de imagen a generar. |
- Devuelve
- Retorna true si todo sale bien o false si no.
◆ PointsX2D() [1/2]
| bool Pds::Octave::Plot::PointsX2D |
( |
const Pds::Matrix & |
X, |
|
|
const std::string & |
octfilename, |
|
|
const std::string & |
imgfilename |
|
) |
| |
◆ PointsX2D() [2/2]
| bool Pds::Octave::Plot::PointsX2D |
( |
const Pds::Matrix & |
X0, |
|
|
const Pds::Matrix & |
X1, |
|
|
const std::string & |
octfilename, |
|
|
const std::string & |
imgfilename |
|
) |
| |
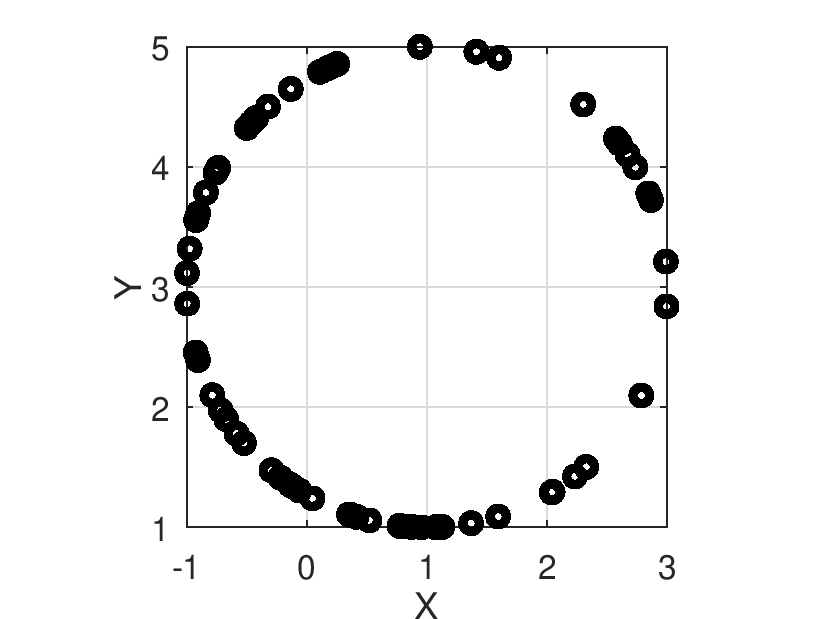
Plot de muestras en 2D en las columnas de X0(blue) y X1(red).
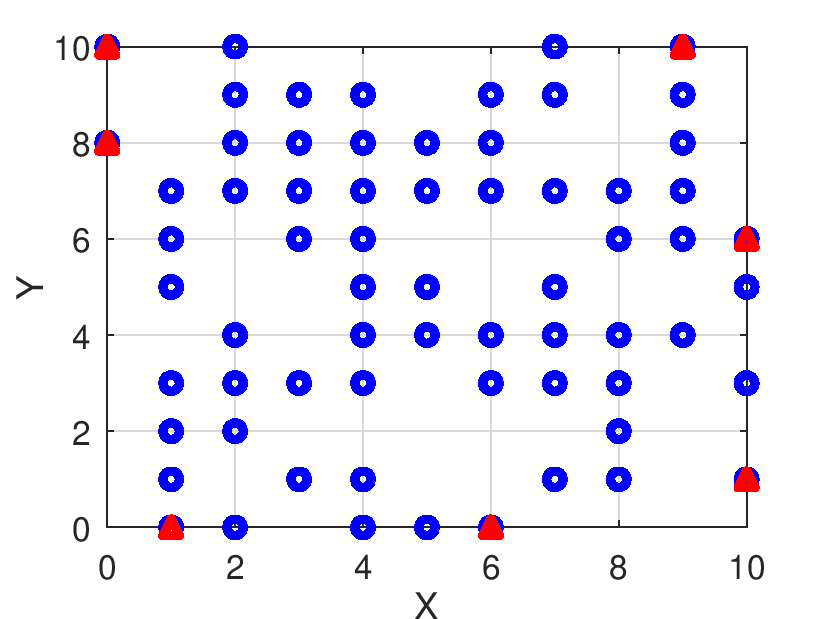
PointsX2D
- Parámetros
-
| [in] | X0 | matriz con muestras 2D en cada linea. Puntos en blue. |
| [in] | X1 | matriz con muestras 2D en cada linea. Puntos en red. |
| [in] | octfilename | Nombre de archivo del archivo octave a generar. |
| [in] | imgfilename | Nombre de archivo del archivo de imagen a generar. |
- Devuelve
- Retorna true si todo sale bien o false si no.
◆ PointsX2DY()
| bool Pds::Octave::Plot::PointsX2DY |
( |
const Pds::Matrix & |
X, |
|
|
const Pds::Vector & |
Y, |
|
|
const std::string & |
octfilename, |
|
|
const std::string & |
imgfilename |
|
) |
| |
◆ PointsX2DYW()
| bool Pds::Octave::Plot::PointsX2DYW |
( |
const Pds::Matrix & |
X, |
|
|
const Pds::Vector & |
Y, |
|
|
const Pds::Vector & |
W, |
|
|
const std::string & |
octfilename, |
|
|
const std::string & |
imgfilename |
|
) |
| |
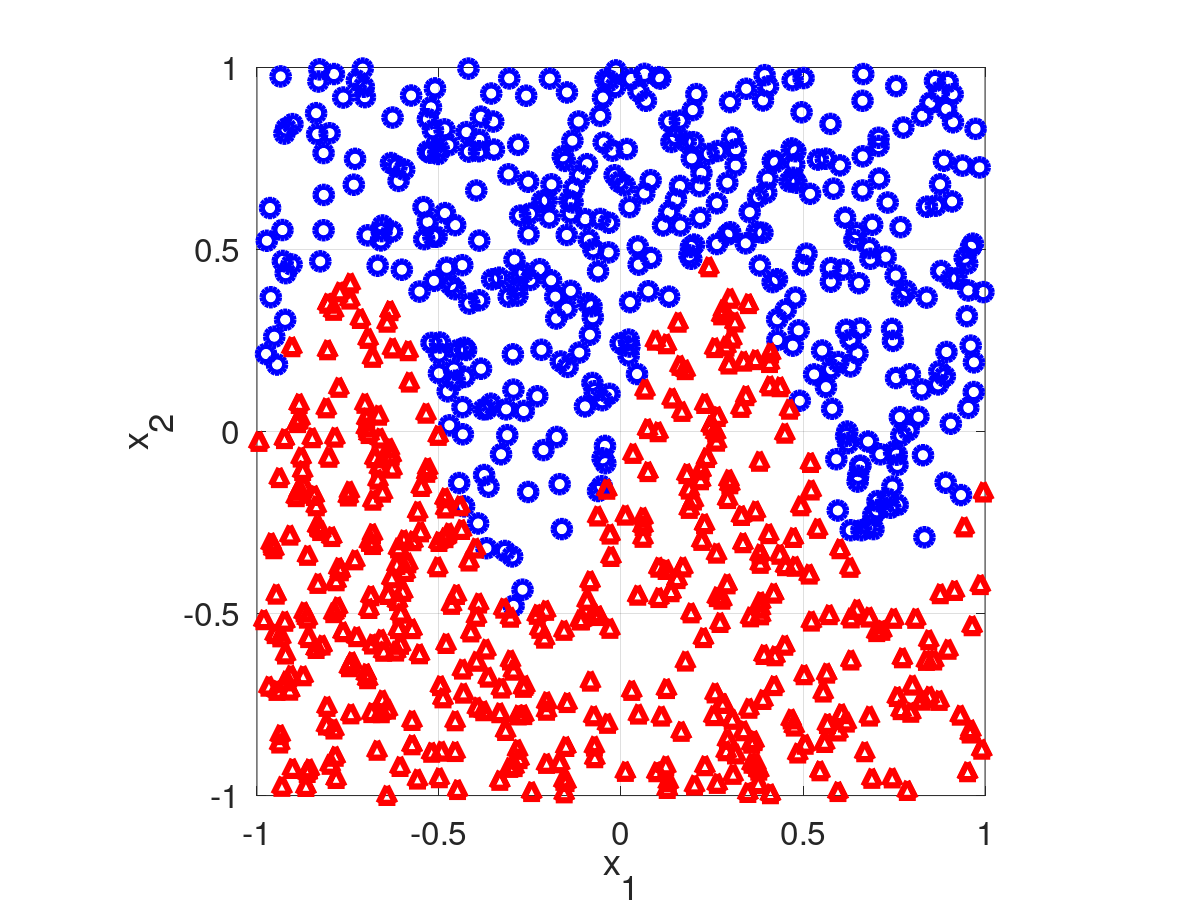
Plot de muestras en 2D en las columnas X, clasificadas de forma binaria con Y>=0.5, 0 para azul 1 para rojo.
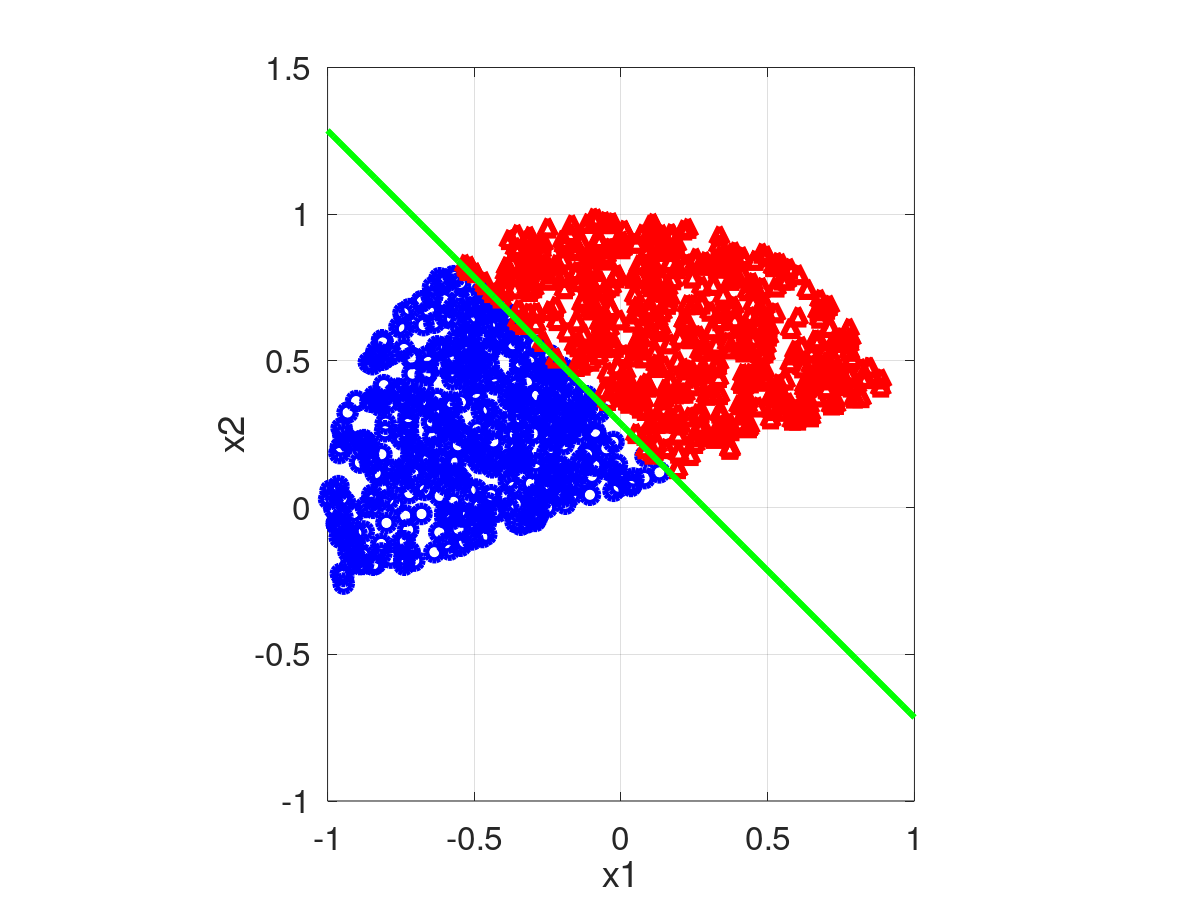
PointsX2DYW
- Parámetros
-
| [in] | X | matriz con muestras 2D en cada linea. |
| [in] | Y | Vector a ser binarizado Y>=0.5, 0 para azul 1 para rojo. |
| [in] | W | Vector de dimensión 3 con el el umbral. |
| [in] | octfilename | Nombre de archivo del archivo octave a generar. |
| [in] | imgfilename | Nombre de archivo del archivo de imagen a generar. |
- Devuelve
- Retorna true si todo sale bien o false si no.
- Ejemplos
- example_optadam_create.cpp.
◆ ScatterX2DY()
| bool Pds::Octave::Plot::ScatterX2DY |
( |
const Pds::Matrix & |
X, |
|
|
const Pds::Vector & |
Y, |
|
|
const std::string & |
octfilename, |
|
|
const std::string & |
imgfilename |
|
) |
| |
Plot de muestras en 2D en las columnas X, muestra los valores de Y con una degradación de colores.
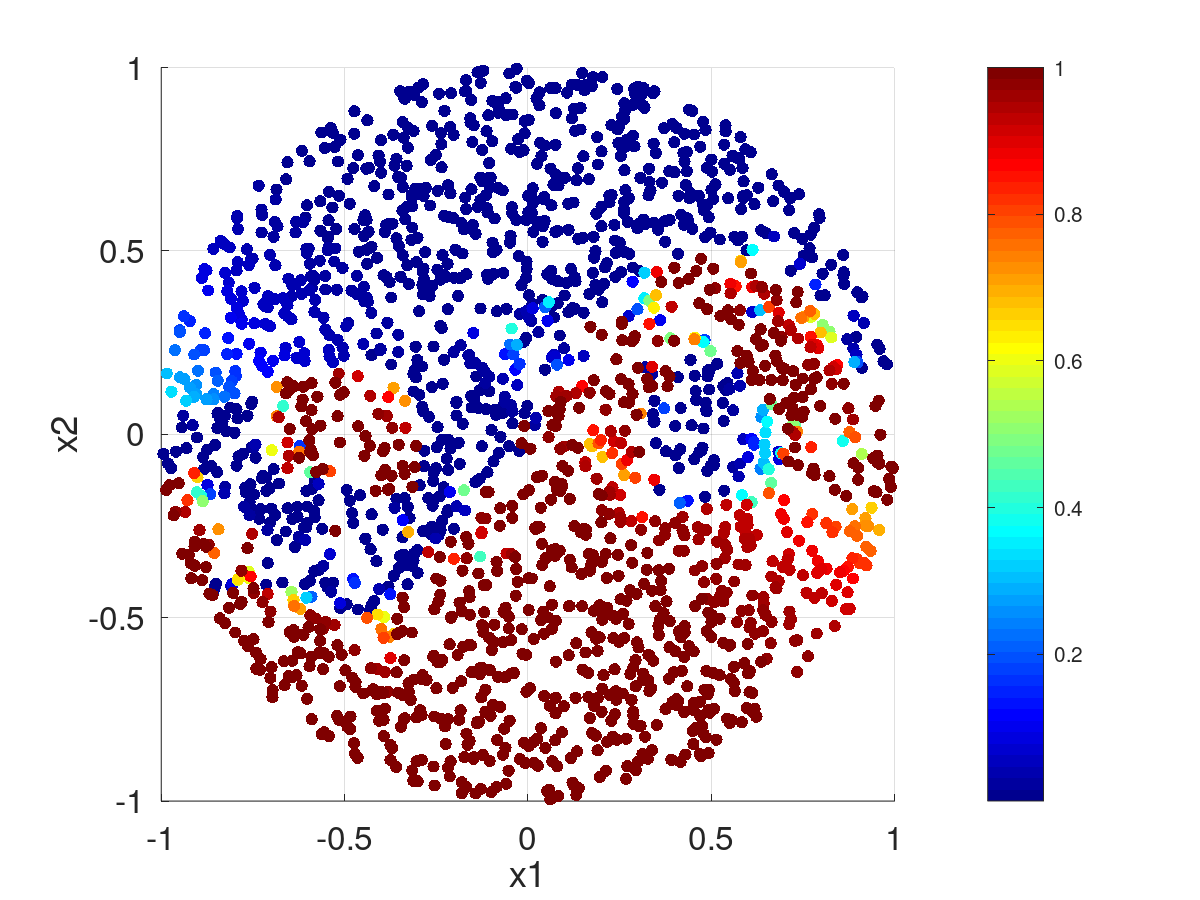
ScatterX2DY
- Parámetros
-
| [in] | X | matriz con muestras 2D en cada linea. |
| [in] | Y | Vector con valores a ser mostrados con una degradación de colores. |
| [in] | octfilename | Nombre de archivo del archivo octave a generar. |
| [in] | imgfilename | Nombre de archivo del archivo de imagen a generar. |
- Devuelve
- Retorna true si todo sale bien o false si no.
- Ejemplos
- example_triangle_evalsamples.cpp y example_triangle_getsamples.cpp.
◆ ScatterX2DYP()
| bool Pds::Octave::Plot::ScatterX2DYP |
( |
const Pds::Matrix & |
X, |
|
|
const Pds::Vector & |
Y, |
|
|
const Pds::Vector & |
P, |
|
|
const std::string & |
octfilename, |
|
|
const std::string & |
imgfilename |
|
) |
| |
Plot de muestras en 2D en las columnas X, muestra los valores de Y con una degradación de colores.
ScatterX2DYP
- Parámetros
-
| [in] | X | matriz con muestras 2D en cada linea. |
| [in] | Y | Vector con valores a ser mostrados con una degradación de colores. |
| [in] | P | Vector con una proporcion del tamanho de los markersize. El vector debe tener elementos positivos mayores que cero. |
| [in] | octfilename | Nombre de archivo del archivo octave a generar. |
| [in] | imgfilename | Nombre de archivo del archivo de imagen a generar. |
- Devuelve
- Retorna true si todo sale bien o false si no.
◆ ScatterX2DYW()
| bool Pds::Octave::Plot::ScatterX2DYW |
( |
const Pds::Matrix & |
X, |
|
|
const Pds::Vector & |
Y, |
|
|
const Pds::Vector & |
W, |
|
|
const std::string & |
octfilename, |
|
|
const std::string & |
imgfilename |
|
) |
| |
Plot de muestras en 2D en las columnas X, muestra los valores de Y con una degradación de colores.
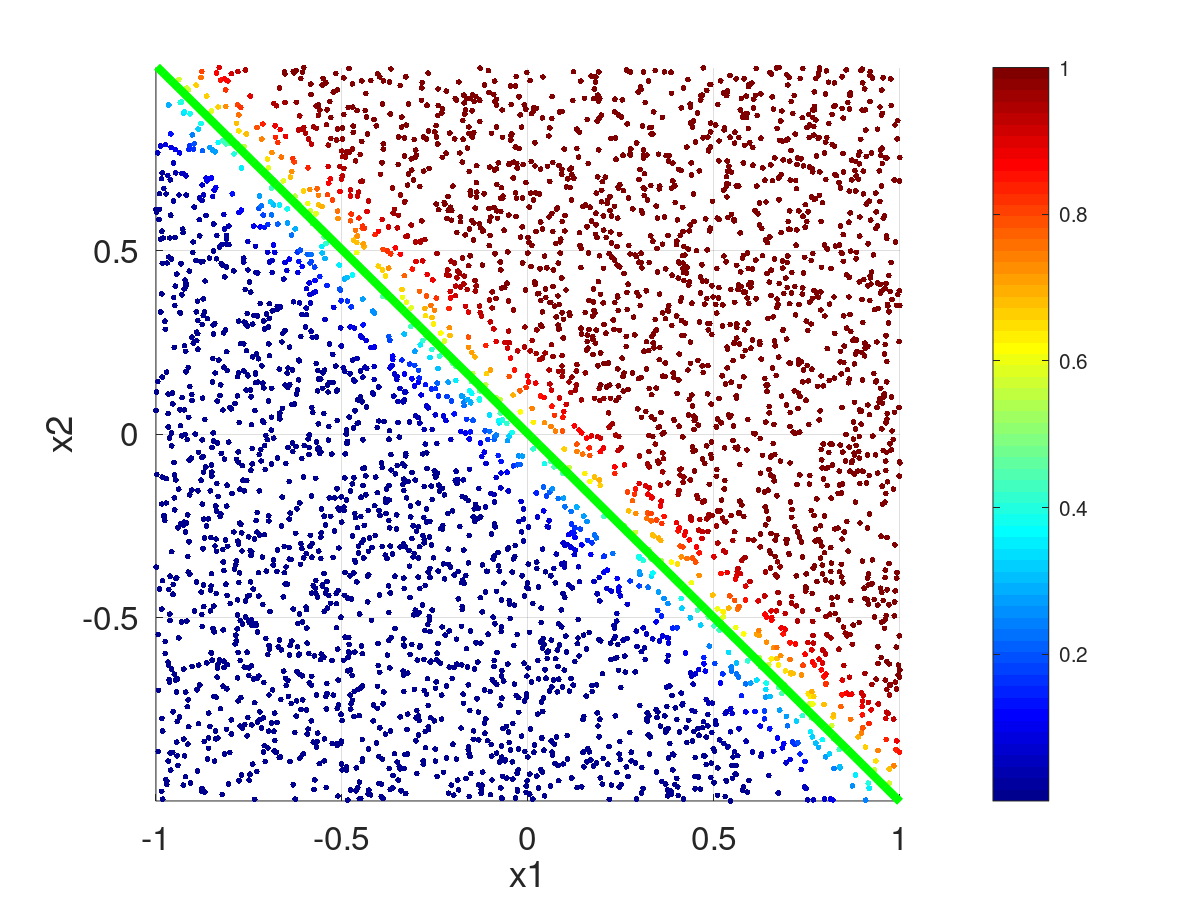
ScatterX2DYW
- Parámetros
-
| [in] | X | matriz con muestras 2D en cada linea. |
| [in] | Y | Vector con valores a ser mostrados con una degradación de colores. |
| [in] | W | Vector de dimensión 3 con el el umbral. |
| [in] | octfilename | Nombre de archivo del archivo octave a generar. |
| [in] | imgfilename | Nombre de archivo del archivo de imagen a generar. |
- Devuelve
- Retorna true si todo sale bien o false si no.
◆ ScatterX3DY()
| bool Pds::Octave::Plot::ScatterX3DY |
( |
const Pds::Matrix & |
X, |
|
|
const Pds::Vector & |
Y, |
|
|
const std::string & |
octfilename, |
|
|
const std::string & |
imgfilename |
|
) |
| |
Plot de muestras en 3D en las columnas X, muestra los valores de Y con una degradación de colores.
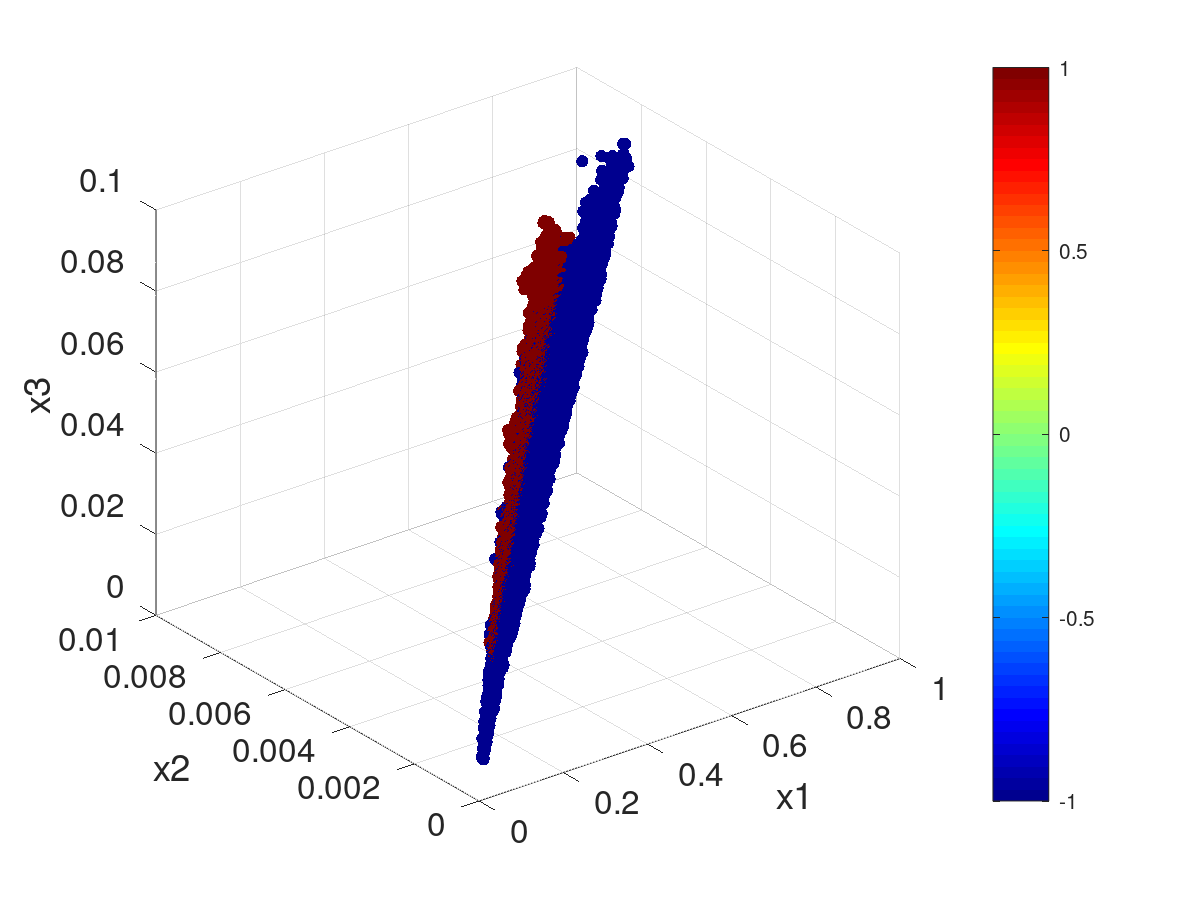
PointsX3DY
- Parámetros
-
| [in] | X | matriz con muestras 3D en cada linea. |
| [in] | Y | Vector con valores a ser mostrados con una degradación de colores. |
| [in] | octfilename | Nombre de archivo del archivo octave a generar. |
| [in] | imgfilename | Nombre de archivo del archivo de imagen a generar. |
- Devuelve
- Retorna true si todo sale bien o false si no.
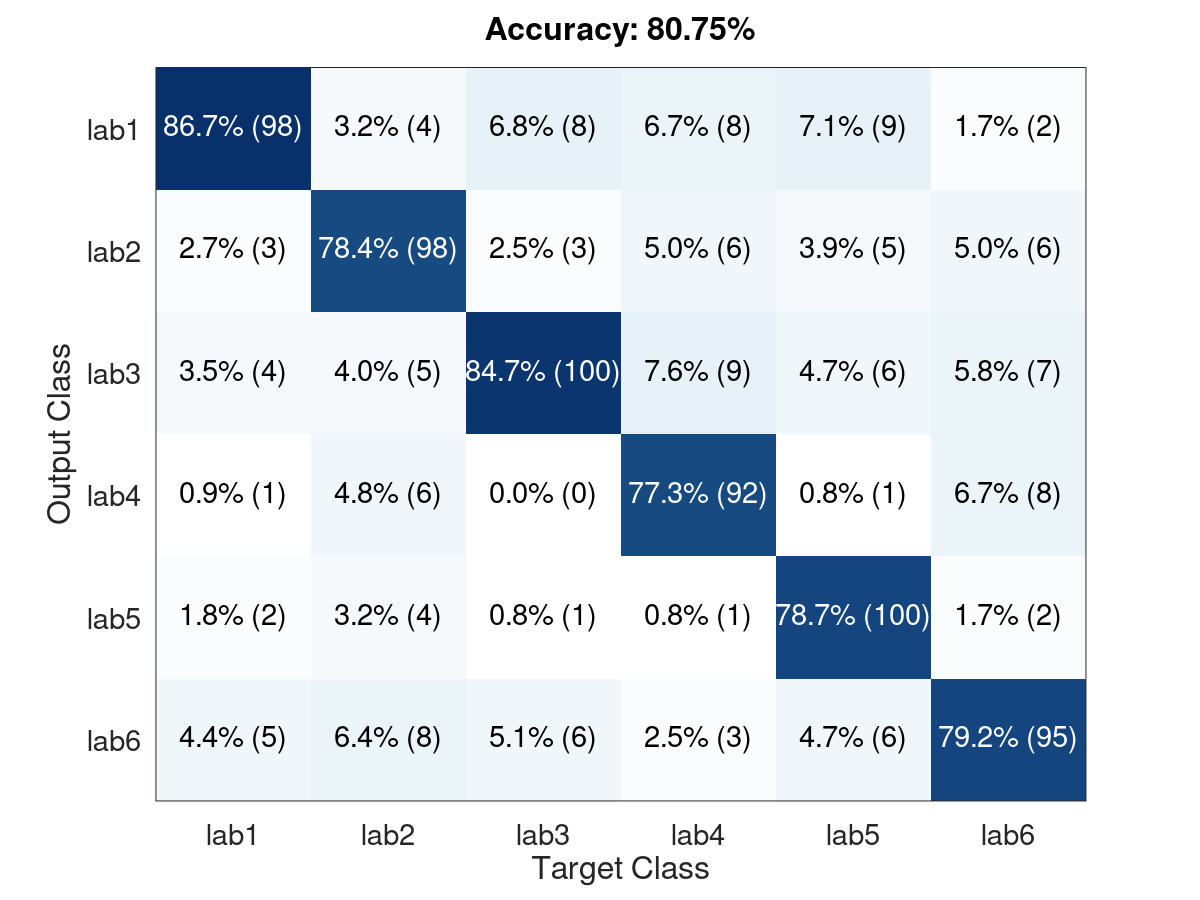
◆ ConfMatrix() [1/2]
| bool Pds::Octave::Plot::ConfMatrix |
( |
const Pds::Matrix & |
A, |
|
|
const std::vector< int > |
Label, |
|
|
const std::string & |
octfilename, |
|
|
const std::string & |
imgfilename |
|
) |
| |
Plot de la matriz de confusion.

Confusion matrix
- Parámetros
-
| [in] | A | Matriz de confusión [predict/Actual]. |
| [in] | Label | Identificadores de las categorias. |
| [in] | octfilename | Nombre de archivo del archivo octave a generar. |
| [in] | imgfilename | Nombre de archivo del archivo de imagen a generar. |
- Devuelve
- Retorna true si todo sale bien o false si no.
- Ejemplos
- example_octave_show.cpp.
◆ ConfMatrix() [2/2]
| bool Pds::Octave::Plot::ConfMatrix |
( |
const Pds::Matrix & |
A, |
|
|
const std::vector< std::string > |
Label, |
|
|
const std::string & |
octfilename, |
|
|
const std::string & |
imgfilename |
|
) |
| |
Plot de la matriz de confusion.
Confusion matrix
- Parámetros
-
| [in] | A | Matriz de confusión [predict/Actual]. |
| [in] | Label | Identificadores de las categorias. |
| [in] | octfilename | Nombre de archivo del archivo octave a generar. |
| [in] | imgfilename | Nombre de archivo del archivo de imagen a generar. |
- Devuelve
- Retorna true si todo sale bien o false si no.
◆ PColor()
| bool Pds::Octave::Plot::PColor |
( |
const Pds::Matrix & |
A, |
|
|
const std::string & |
octfilename, |
|
|
const std::string & |
imgfilename |
|
) |
| |
Plot la matriz usando pcolor.
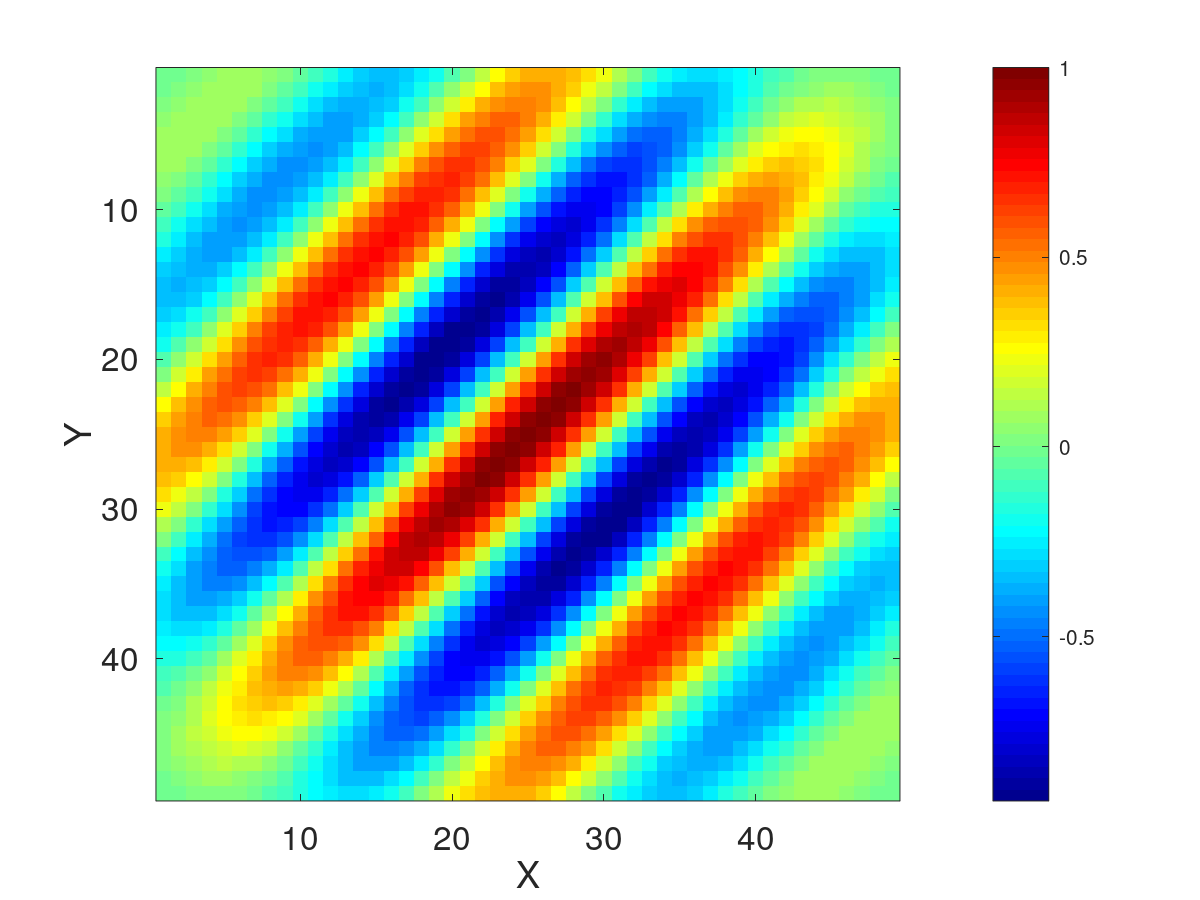
PColor
- Parámetros
-
| [in] | A | Matriz a describir. |
| [in] | octfilename | Nombre de archivo del archivo octave a generar. |
| [in] | imgfilename | Nombre de archivo del archivo de imagen a generar. |
- Devuelve
- Retorna true si todo sale bien o false si no.
◆ ImageSc()
| bool Pds::Octave::Plot::ImageSc |
( |
const Pds::Matrix & |
A, |
|
|
const std::string & |
octfilename, |
|
|
const std::string & |
imgfilename |
|
) |
| |
◆ Surf() [1/2]
| bool Pds::Octave::Plot::Surf |
( |
const Pds::Matrix & |
X, |
|
|
const Pds::Matrix & |
Y, |
|
|
const Pds::Matrix & |
Z, |
|
|
const std::string & |
octfilename, |
|
|
const std::string & |
imgfilename |
|
) |
| |
◆ Surf() [2/2]
| bool Pds::Octave::Plot::Surf |
( |
const Pds::Matrix & |
Z, |
|
|
const std::string & |
octfilename, |
|
|
const std::string & |
imgfilename |
|
) |
| |
Plot la matriz usando surf.
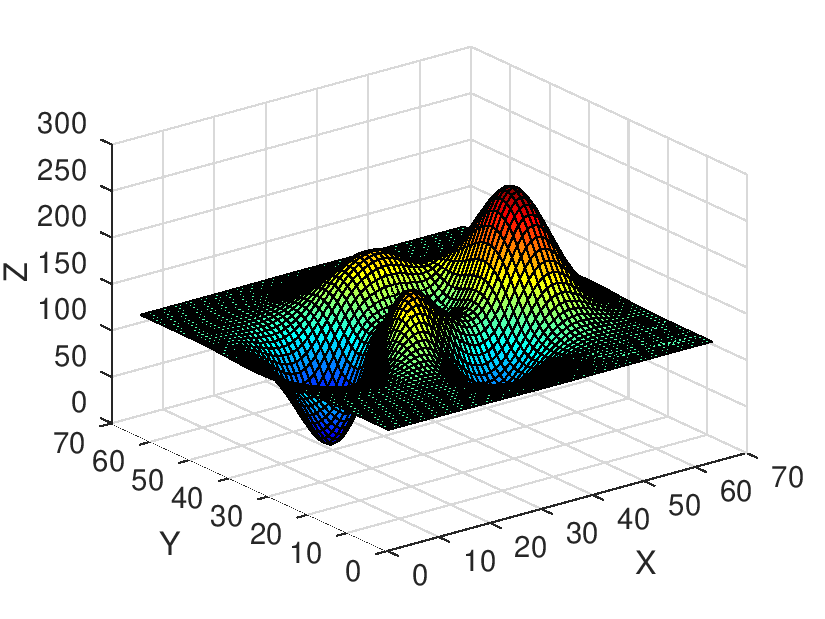
surf
- Parámetros
-
| [in] | Z | Matriz Z. |
| [in] | octfilename | Nombre de archivo del archivo octave a generar. |
| [in] | imgfilename | Nombre de archivo del archivo de imagen a generar. |
- Devuelve
- Retorna true si todo sale bien o false si no.
◆ SurfC()
| bool Pds::Octave::Plot::SurfC |
( |
const Pds::Matrix & |
X, |
|
|
const Pds::Matrix & |
Y, |
|
|
const Pds::Matrix & |
Z, |
|
|
const std::string & |
octfilename, |
|
|
const std::string & |
imgfilename |
|
) |
| |
Plot la matriz usando surfc.
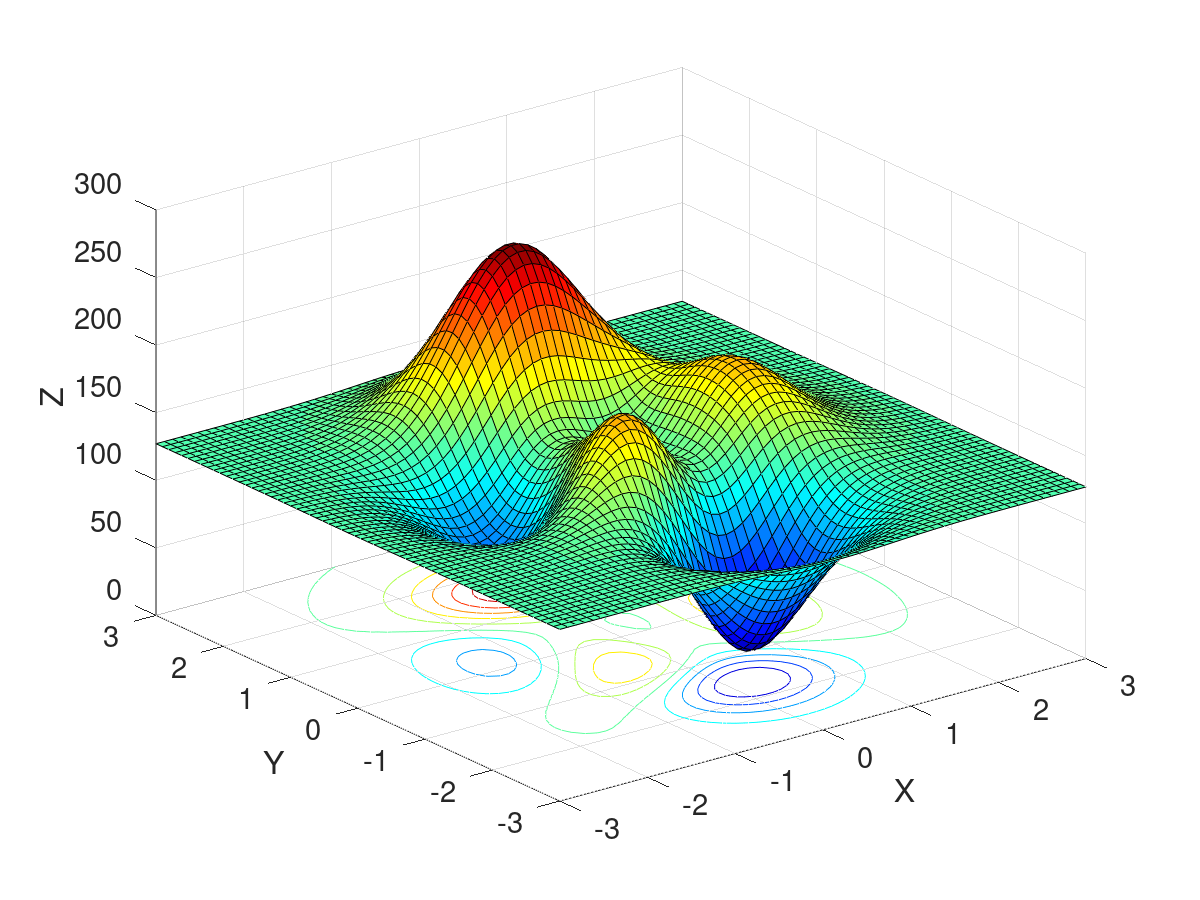
surf
- Parámetros
-
| [in] | X | Matriz X. |
| [in] | Y | Matriz Y. |
| [in] | Z | Matriz Z. |
| [in] | octfilename | Nombre de archivo del archivo octave a generar. |
| [in] | imgfilename | Nombre de archivo del archivo de imagen a generar. |
- Devuelve
- Retorna true si todo sale bien o false si no.
- Ejemplos
- example_octave_show.cpp.
◆ SurfCWithPoint()
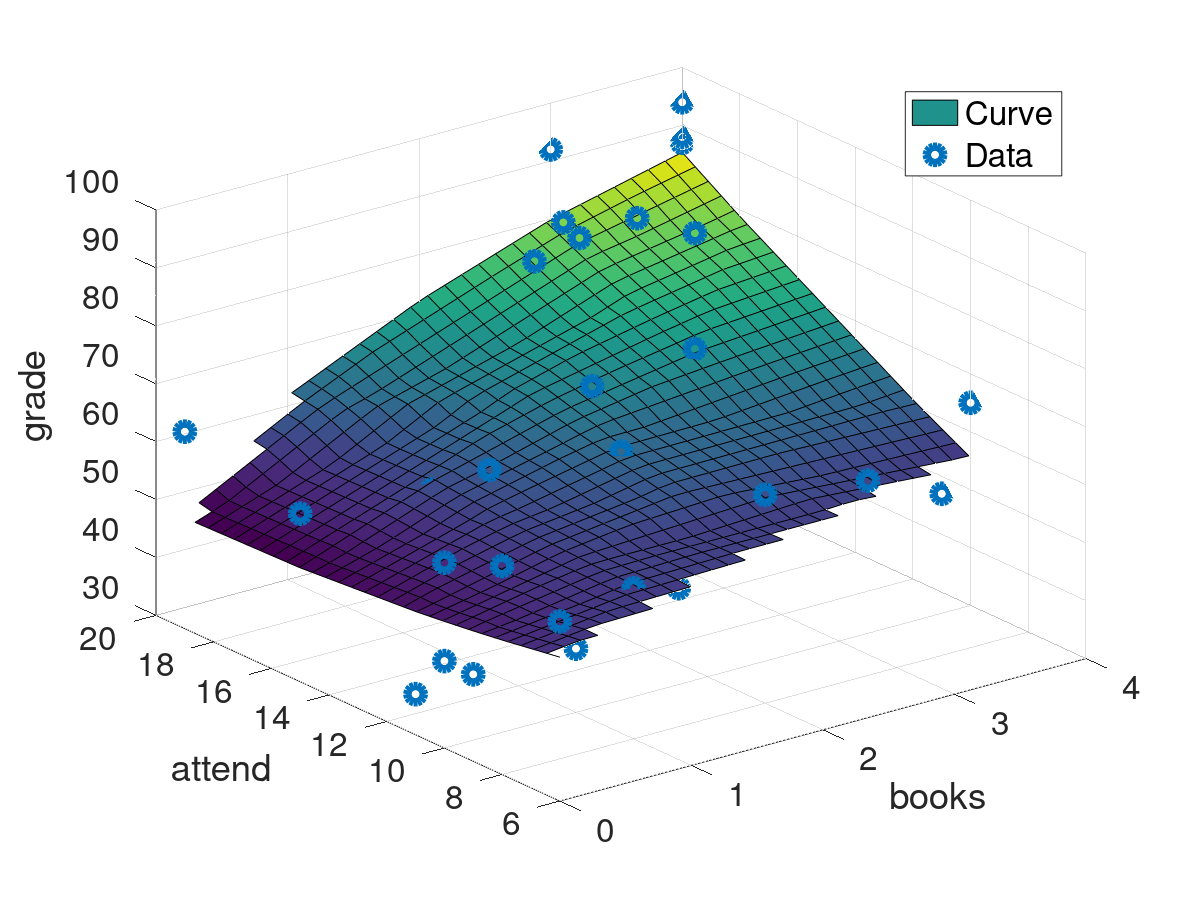
Plot la matriz usando surfc y un punto usando scatter3.
surf
- Parámetros
-
| [in] | X | Matriz X. |
| [in] | Y | Matriz Y. |
| [in] | Z | Matriz Z. |
| [in] | P3 | Vector de 3D que representa un punto. |
| [in] | octfilename | Nombre de archivo del archivo octave a generar. |
| [in] | imgfilename | Nombre de archivo del archivo de imagen a generar. |
- Devuelve
- Retorna true si todo sale bien o false si no.
◆ PairwiseScatterXY()
| bool Pds::Octave::Plot::PairwiseScatterXY |
( |
const Pds::Matrix & |
X, |
|
|
const Pds::Vector & |
Y, |
|
|
const std::string & |
octfilename, |
|
|
const std::string & |
imgfilename |
|
) |
| |
Plot a pair wise scatter3 de las columnas de X.

PairwiseScatterXY
- Parámetros
-
| [in] | X | Matriz X. |
| [in] | Y | Matriz Y. |
| [in] | octfilename | Nombre de archivo del archivo octave a generar. |
| [in] | imgfilename | Nombre de archivo del archivo de imagen a generar. |
- Devuelve
- Retorna true si todo sale bien o false si no.
- Ejemplos
- example_octave_pairwisescatterxy.cpp.
◆ Cmd
| std::string Pds::Octave::Cmd |
|
extern |
Comando que será usado para invocar a octave. Por defecto:
◆ Cwd
Indica si se habilitará o no ejecutar octave en current working directory. Por defecto:
◆ Colormap
| std::string Pds::Octave::Colormap |
|
extern |
Corlormap usado en el código octave. Por defecto:
◆ FontSize
| unsigned int Pds::Octave::FontSize |
|
extern |
◆ LineWidth
| unsigned int Pds::Octave::LineWidth |
|
extern |
◆ MarkerSize
| unsigned int Pds::Octave::MarkerSize |
|
extern |
◆ DAspect
| bool Pds::Octave::DAspect |
|
extern |
◆ XLimits
| bool Pds::Octave::XLimits |
|
extern |
Habilita o deshabilita xlim(...) en el código octave. Por defecto:
◆ YLimits
| bool Pds::Octave::YLimits |
|
extern |
Habilita o deshabilita ylim(...) en el código octave. Por defecto:
◆ ZLimits
| bool Pds::Octave::ZLimits |
|
extern |
Habilita o deshabilita zlim(...) en el código octave. Por defecto:
◆ Title
| std::string Pds::Octave::Title |
|
extern |
Texto correspondente al título. Exemplo:
◆ XLabel
| std::string Pds::Octave::XLabel |
|
extern |
◆ YLabel
| std::string Pds::Octave::YLabel |
|
extern |
◆ ZLabel
| std::string Pds::Octave::ZLabel |
|
extern |
Texto correspondente a zlabel. Exemplo:
◆ Legend
| std::vector<std::string> Pds::Octave::Legend |
|
extern |


 1.9.4
1.9.4